The Accuracy Benchmark of Manual Landmark Annotation
Basic Philosophy
To access further details and for proper citation, we kindly direct you to our publication: (hyperlink will be provided shortly).
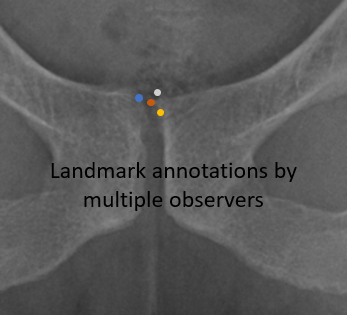
- In the context of annotating landmarks within an image, the central point of the coordinates collectively marked by multiple observers is considered the pivotal “ground-truth” reference.
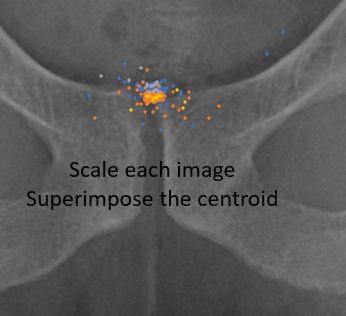
- Under the situations where the anatomies or images share a similar size or scale, the centroids of these landmarks can be overlaid for their distributions.


Methodology
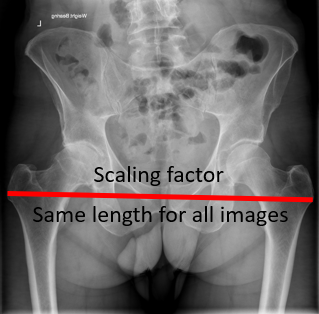
- Opt for a suitable length parameter to serve as your scaling coefficient This choice should ensure that the landmarks remain distinctly discernible across a majority of images, with the selected length being sufficiently extended to mitigate the impact of errors.
- Enlist a team of annotators to meticulously annotate both the landmarks and your chosen scaling factor on each image.
- Standardize the images to a consistent scale by referencing your designated scaling factor. Subsequently, overlay the centroids of these landmarks to facilitate the computation of their distribution.
Note
- Should your landmark’s position be derivable through the identification of anatomical contours within an image, we recommend adopting a strategy of annotating these contours. This approach allows for precise calculation of the landmark’s location, rather than resorting to estimations. For instance, when seeking to locate the center of the femoral head, consider outlining the femoral head’s contour either through circle fitting or the annotation of three defining points. This facilitates accurate center calculation based on the gathered coordinates, steering clear of subjective estimations.
- Exercise diligence in the training of your annotators. It’s imperative that every participant harbors a uniform understanding of landmark location. This consistency in conceptualization ensures that all observers approach the task with congruent perspectives.
Calculations
We use the calculation of an angle parameter (pelvic tilt in this case, defined by the vertical line and the line connecting Landmark 1 and Landmark 2) as an example. The calculation for a length parameter is simpler.
1. Scaling factor {\eta}:
where the {\eta_i} is a ratio to unify the size of image i; {L_i} and {\widehat{L_i}} are the distances between {P_a}, {P_p}, {P_h}, and {P_s}, respectively; N is the total image amount.
2. Assuming we have n observers, for observer s, the coordinate of landmark j on the image:
where ({x_{i j}^{(s)}, y_{i j}^{(s)}}) and ({\hat{x}_{i j}^{(s)}, \hat{y}_{i j}^{(s)}}) is the original and centralized coordinate of landmark j on the image i.
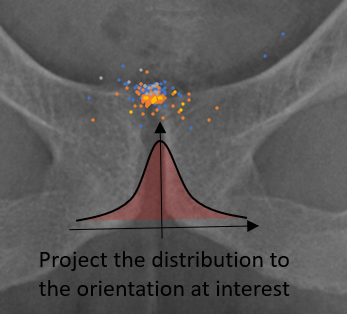
3. These points were projected to an axis representing the average pelvic tilt ({\theta_{ave}}) for their density distribution at the direction of interest. The projected coordinates can be expressed as follows:
4. The landmark accuracy is calculated from the maximum impact of the distance of k% data points of the two ends ({P_1} and {P_2}) on the pelvic tilt ({\theta_{\max}^k}):

